
Power BI Formula Reference
Power BI DAX Cheat Sheet
Build better Power BI calculations with practical DAX functions, measures, context rules, time-intelligence patterns, and copy-ready formulas. Quickly find the syntax and example you need.
- Practical measures
- Copy-ready formulas
- Context explained
- Printable reference
Total Sales =
SUMX(
    Sales,
    Sales[Quantity]
        * Sales[Unit Price]
)
DAX Formula Finder
Find a DAX Function or Pattern
Search this DAX cheat sheet for functions, measures, filter context, time intelligence, relationships, errors, and practical Power BI formulas.
01 — Quick Reference
DAX Quick Reference
Use this table to quickly compare essential DAX functions, understand their purpose, and copy practical measure examples for Power BI or Power Pivot data models.
| Function | Purpose | Measure or Formula Example |
|---|---|---|
SUM |
Adds all numeric values in one column. |
Total Sales = SUM(Sales[Sales Amount])
|
SUMX |
Evaluates an expression for each row and returns the sum. |
Gross Sales =
SUMX(
    Sales,
    Sales[Quantity] * Sales[Unit Price]
)
|
CALCULATE |
Evaluates an expression in a modified filter context. |
Blue Sales =
CALCULATE(
    [Total Sales],
    Product[Color] = "Blue"
)
|
DIVIDE |
Safely divides two expressions and handles division by zero. |
Margin % =
DIVIDE(
    [Gross Profit],
    [Total Sales],
    0
)
|
COUNTROWS |
Counts rows in a table or table expression. |
Sales Rows = COUNTROWS(Sales)
|
DISTINCTCOUNT |
Counts distinct values in a column, including BLANK. |
Unique Customers =
DISTINCTCOUNT(Sales[CustomerKey])
|
FILTER |
Returns only rows that satisfy a Boolean condition. |
Large Sales =
CALCULATE(
    [Total Sales],
    FILTER(
        Sales,
        Sales[Sales Amount] > 1000
    )
)
|
REMOVEFILTERS |
Clears filters from specified tables or columns. |
All Product Sales =
CALCULATE(
    [Total Sales],
    REMOVEFILTERS(Product)
)
|
SELECTEDVALUE |
Returns one selected value or an alternate result. |
Selected Category =
SELECTEDVALUE(
    Product[Category],
    "Multiple Categories"
)
|
RELATED |
Returns a related value through an existing model relationship. |
Product Category =
RELATED(Product[Category])
|
DATEADD |
Shifts dates forward or backward by a specified interval. |
Sales Previous Year =
CALCULATE(
    [Total Sales],
    DATEADD('Date'[Date], -1, YEAR)
)
|
TOTALYTD |
Evaluates an expression from the start of the year through the current context. |
Sales YTD =
TOTALYTD(
    [Total Sales],
    'Date'[Date]
)
|
02 — DAX Fundamentals
What Is DAX?
Data Analysis Expressions, usually shortened to DAX, is a formula expression language used to create calculations in tabular data models. It is commonly used in Power BI, Power Pivot for Excel, and Analysis Services.
Measures
Measures calculate dynamic results that respond to report filters, slicers, rows, columns, and the current evaluation context.
Calculated Columns
Calculated columns evaluate a DAX expression for every row and store the resulting values in the data model.
Calculated Tables
Calculated tables use DAX expressions to create new model tables from existing tables or other table expressions.
Row-Level Security
DAX Boolean expressions can define which model rows are available to members of a specific security role.
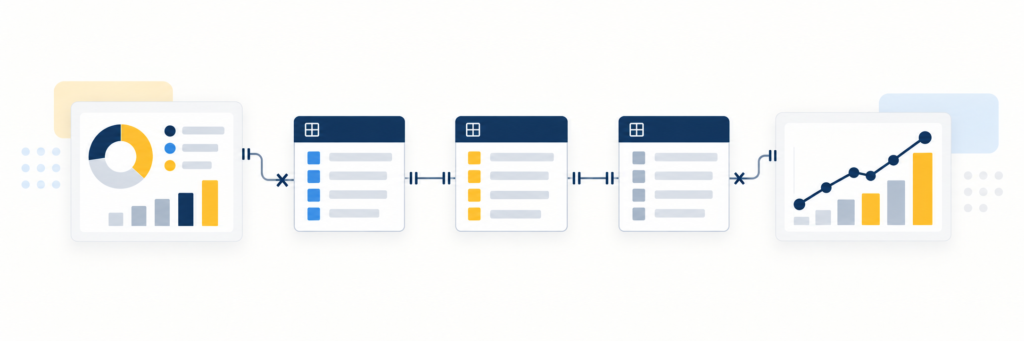
Where DAX fits in a typical Power BI workflow
Connect, clean, combine, and transform source data before loading.
Organize data into related fact and dimension tables.
Create measures and calculations that respond to report context.
03 — Formula Foundations
DAX Syntax, Operators & Data Types
DAX expressions combine functions, operators, constants, measures, tables, and columns. Correct object references and consistent data types are essential for reliable Power BI calculations.
Anatomy of a DAX measure
A measure begins with its name, followed by an equals sign and an expression that returns a scalar value.
Net Sales =
VAR GrossSales =
    SUMX(
        Sales,
        Sales[Quantity] * Sales[Unit Price]
    )
VAR Discounts =
    SUM(Sales[Discount Amount])
RETURN
    GrossSales - Discounts
DAX operators
Operators perform arithmetic, compare values, join text, or combine logical conditions.
| Category | Operators | Example |
|---|---|---|
| Arithmetic |
+
-
*
/
^
|
Sales[Quantity] * Sales[Unit Price] |
| Comparison |
=
==
<>
>
<
>=
<=
|
Sales[Amount] >= 1000 |
| Logical |
&&
||
IN
NOT
|
Product[Color] IN { "Red", "Blue" } |
| Text | & |
Customer[City] & ", " & Customer[Country] |
| Grouping | ( ) |
(Sales[Price] - Sales[Cost]) * Sales[Quantity] |
Common DAX data types
DAX usually determines the result type automatically, but incompatible values can still produce errors or unexpected implicit conversions.
125
Counts, quantities, and integer identifiers.
19.95
Measurements and values requiring decimal precision.
149.9900
Currency-style values with fixed precision.
TRUE / FALSE
Logical conditions and comparison results.
"North"
Names, labels, categories, and text identifiers.
DATE(2026, 9, 10)
Dates and times used in calendar calculations.
BLANK()
Represents a missing or empty value in DAX.
FILTER(Sales, ...)
An intermediate table passed into another function.
04 — Calculation Types
Measures, Calculated Columns & Calculated Tables
DAX can return a dynamic measure, add a value to every row of an existing table, or create an entirely new table. Choosing the correct calculation type affects how results behave, when they are evaluated, and how much model storage they may require.
Measure
Returns a dynamic scalar result based on the current report and filter context.
- Evaluated when a report query requests the result.
- Changes with slicers, filters, rows, and columns.
- Ideal for totals, percentages, ratios, and KPIs.
Total Sales =
SUM(Sales[Sales Amount])
Calculated Column
Adds a DAX-generated value to every row of an existing model table.
- Evaluated in row context for each row.
- Usually recalculated when imported model data refreshes.
- Useful for categories, labels, sorting, and relationships.
Line Amount =
Sales[Quantity] * Sales[Unit Price]
Calculated Table
Creates a new model table from an expression that returns a table.
- Becomes part of the semantic model.
- Can contain columns, measures, and relationships.
- Useful for date tables and intermediate model structures.
Date Table =
CALENDAR(
    DATE(2024, 1, 1),
    DATE(2026, 12, 31)
)
Calculation types compared
Use this comparison to choose the correct DAX object before writing the formula.
| Type | Returns | Evaluation | Best Used For | Model Impact |
|---|---|---|---|---|
| Measure | One scalar result per context | At query time | Aggregations, ratios, KPIs, and dynamic analysis | The formula definition is stored; results respond dynamically to context. |
| Calculated Column | One value for each table row | Typically during model processing or refresh for Import models | Grouping, filtering, sorting, labels, and relationship keys | Materialized columns can increase model size. |
| Calculated Table | A complete table | When the model is processed or refreshed | Date tables, unions, supporting dimensions, and intermediate structures | Adds rows and columns to the model. |
The result should respond dynamically to report filters or represent an aggregation, percentage, ratio, or business KPI.
You need a row-level value that can be placed on an axis, used as a slicer, sorted, grouped, or used in a relationship.
You need a new model table derived from existing model data rather than a single analytical result.
05 — Evaluation Context
Row Context, Filter Context & Evaluation Context
Context determines which data a DAX expression can see when it is evaluated. The same measure can return different results in every row, visual, or filter selection without changing its formula.
Row Context
Row context represents the current row being evaluated. It exists
naturally in calculated columns and is created by iterator functions
such as SUMX, FILTER, and
ADDCOLUMNS.
- Provides access to column values from the current row.
- Does not automatically filter the entire model.
- Can exist inside another row context during nested iteration.
Line Amount =
Sales[Quantity] * Sales[Unit Price]
Filter Context
Filter context is the set of values currently allowed for model columns. It can come from visuals, slicers, report filters, relationships, or filters written directly inside a DAX expression.
- Controls which rows contribute to a measure result.
- Propagates through active model relationships.
- Can be added, replaced, preserved, or removed with DAX.
Blue Sales =
CALCULATE(
    [Total Sales],
    Product[Color] = "Blue"
)
How filter context reaches a measure
A report interaction creates filters, relationships propagate those filters, and the measure evaluates over the remaining rows.
A user selects a year, region, product, or other report value.
Active relationships propagate the relevant filters between tables.
The measure evaluates using only rows allowed by the final context.
One measure, several results
This measure definition stays unchanged, but each category row supplies a different filter context.
Total Sales =
SUM(Sales[Sales Amount])
| Product Category | Total Sales |
|---|---|
| Bikes | $84,000 |
| Accessories | $23,000 |
| Clothing | $13,000 |
| Total | $120,000 |
A measure has no inherent current row. Its result is determined by the context supplied by the report or expression.
An X-function evaluates its expression once for every row of its table argument before aggregating the results.
Filters applied to dimension tables can affect related fact-table rows through active model relationships.
06 — Core DAX Function
CALCULATE & Context Transition
CALCULATE evaluates an expression in a modified filter context. It is one of the most important DAX functions because it can add, replace, preserve, or remove filters before evaluating a measure or scalar expression.
CALCULATE syntax
The first argument is the expression to evaluate. Additional arguments define how its filter context should change.
CALCULATE(
    <expression>,
    <filter1>,
    <filter2>
)
Calculate sales for one color
Adds a Blue filter when no filter already exists for the Color column.
Blue Sales =
CALCULATE(
    [Total Sales],
    Product[Color] = "Blue"
)
Use the IN operator
Filters the calculation to products whose color is Red or Blue.
Red or Blue Sales =
CALCULATE(
    [Total Sales],
    Product[Color] IN { "Red", "Blue" }
)
Ignore product categories
Clears only the Category filter while keeping other report filters.
Sales All Categories =
CALCULATE(
    [Total Sales],
    REMOVEFILTERS(Product[Category])
)
Intersect with the existing selection
KEEPFILTERS adds the Red condition without replacing an existing filter on the same column.
Red Sales Kept =
CALCULATE(
    [Total Sales],
    KEEPFILTERS(
        Product[Color] = "Red"
    )
)
What is context transition?
When CALCULATE is used without filter arguments inside an existing row context, it converts the current row context into filter context.
A calculated column is evaluating one row of the Customer table.
Values from the current row become filters over corresponding model columns.
The relationship propagates the customer filter to the Sales table.
Customer Sales =
CALCULATE(
    [Total Sales]
)
If the target column is not already filtered, CALCULATE adds the new filter to the current context.
By default, a new filter on an already-filtered column replaces the existing filter for that column.
KEEPFILTERS intersects the new condition with the existing filter instead of replacing it.
07 — Reusable Expressions
Variables with VAR & RETURN
VAR stores the result of a scalar or table expression under a temporary name. RETURN then defines the final result of the calculation. Variables make complex DAX easier to read, reuse, test, and maintain.
Complete measure example
This measure stores the current and previous-year sales before calculating year-over-year growth.
Sales YoY Growth % =
VAR CurrentSales =
    [Total Sales]
VAR PriorYearSales =
    CALCULATE(
        [Total Sales],
        SAMEPERIODLASTYEAR('Date'[Date])
    )
VAR SalesDifference =
    CurrentSales - PriorYearSales
RETURN
    DIVIDE(
        SalesDifference,
        PriorYearSales
    )
Descriptive names make the final expression easier to understand.
Store an expression once and reference its result several times.
Avoid unnecessarily evaluating the same expression repeatedly.
Temporarily return one variable to inspect an intermediate result.
Common variable patterns
Variables can store scalar values, measure results, or entire table expressions for use later in the same calculation.
Calculate a margin percentage
Store revenue and cost once, then reuse them in the final expression.
Margin % =
VAR Revenue =
    [Total Sales]
VAR Cost =
    [Total Cost]
VAR Profit =
    Revenue - Cost
RETURN
    DIVIDE(Profit, Revenue)
Calculate high-value sales
Store a filtered table and pass it into CALCULATE.
High-Value Sales =
VAR HighValueRows =
    FILTER(
        Sales,
        Sales[Sales Amount] >= 1000
    )
RETURN
    CALCULATE(
        [Total Sales],
        HighValueRows
    )
Return a target status
Store the values used by a business rule before testing the result.
Target Status =
VAR ActualSales =
    [Total Sales]
VAR SalesTarget =
    [Sales Target]
RETURN
    IF(
        ActualSales >= SalesTarget,
        "Target Met",
        "Below Target"
    )
Avoid misleading results
Check an intermediate value before returning the calculation.
Average Order Value =
VAR Revenue =
    [Total Sales]
VAR Orders =
    [Order Count]
RETURN
    IF(
        ISBLANK(Orders),
        BLANK(),
        DIVIDE(Revenue, Orders)
    )
Variable naming and scope rules
Variables exist only inside the expression where they are declared.
| Rule | Valid Example | Avoid |
|---|---|---|
| No spaces | PriorYearSales |
Prior Year Sales |
| Do not start with a number | Year2025Sales |
2025Sales |
| No brackets or quotation marks | GrossProfit |
[GrossProfit] |
| Use an earlier variable | Profit = Revenue - Cost |
Referencing a variable before it is declared |
| Keep variables local | Reuse within the same measure | Referencing the variable from another measure |
Sales YoY Growth % =
VAR CurrentSales =
    [Total Sales]
VAR PriorYearSales =
    CALCULATE(
        [Total Sales],
        SAMEPERIODLASTYEAR('Date'[Date])
    )
RETURN
    PriorYearSales
08 — Core Functions
DAX Aggregation Functions
Aggregation functions summarize values from a column or count rows in a table. Their results respond to the current filter context, so the same measure can return different totals for each report category, date, or selection.
| Function | Purpose | Syntax | Measure Example |
|---|---|---|---|
| SUM | Adds all numeric values in a column. | SUM(<column>) |
Total Sales =
SUM(Sales[Sales Amount])
|
| AVERAGE | Returns the arithmetic mean of the numbers in a column. | AVERAGE(<column>) |
Average Sale Amount =
AVERAGE(Sales[Sales Amount])
|
| MIN | Returns the smallest value in a column. | MIN(<column>) |
Lowest Sale =
MIN(Sales[Sales Amount])
|
| MAX | Returns the largest value in a column. | MAX(<column>) |
Latest Order Date =
MAX(Sales[Order Date])
|
| COUNT | Counts nonblank numbers, dates, or text values in a column. Boolean values are not supported. | COUNT(<column>) |
Populated Order IDs =
COUNT(Sales[Order ID])
|
| COUNTA | Counts nonblank values and supports Boolean columns. | COUNTA(<column>) |
Orders with Status =
COUNTA(Sales[Status])
|
| COUNTBLANK | Counts blank values in a column. Zero is not considered blank. | COUNTBLANK(<column>) |
Missing Delivery Dates =
COUNTBLANK(Sales[Delivery Date])
|
| COUNTROWS | Counts rows in a table or an expression that returns a table. | COUNTROWS(<table>) |
Sales Rows =
COUNTROWS(Sales)
|
| DISTINCTCOUNT | Counts distinct values in a column, including BLANK. | DISTINCTCOUNT(<column>) |
Unique Customers =
DISTINCTCOUNT(Sales[CustomerKey])
|
Which counting function should you use?
Choose the function based on whether you need to count table rows, populated values, missing values, or unique values.
Usually the clearest choice when you need the number of records in a table or filtered table expression.
Use when you specifically need to count nonblank values in a column, including Boolean values.
Use for data-quality checks such as missing dates, categories, identifiers, or status values.
Use for unique customers, products, orders, employees, or other identifiers.
Positive Sales Rows =
COUNTROWS(
    FILTER(
        Sales,
        Sales[Sales Amount] > 0
    )
)
09 — Row-by-Row Calculations
DAX Iterator Functions
Iterator functions evaluate an expression separately for every row of a table and then aggregate the resulting values. Their names commonly end with X, as in SUMX, AVERAGEX, MINX, and MAXX.
The first argument is a physical table or an expression that returns a table.
The second argument is calculated once for every row in the table.
The iterator sums, averages, counts, or compares the row-level results.
Essential iterator functions
Each function accepts a table as its first argument and an expression evaluated for every row as its second argument.
| Function | Purpose | Syntax | Measure Example |
|---|---|---|---|
| SUMX | Sums the result of an expression evaluated for every row. |
SUMX(<table>, <expression>)
|
Gross Sales =
SUMX(
    Sales,
    Sales[Quantity] * Sales[Unit Price]
)
|
| AVERAGEX | Returns the arithmetic mean of the evaluated row expressions. |
AVERAGEX(<table>, <expression>)
|
Average Line Value =
AVERAGEX(
    Sales,
    Sales[Quantity] * Sales[Unit Price]
)
|
| MINX | Returns the lowest result produced by the row expression. |
MINX(<table>, <expression>)
|
Smallest Line Value =
MINX(
    Sales,
    Sales[Quantity] * Sales[Unit Price]
)
|
| MAXX | Returns the highest result produced by the row expression. |
MAXX(<table>, <expression>)
|
Largest Line Value =
MAXX(
    Sales,
    Sales[Quantity] * Sales[Unit Price]
)
|
| COUNTX | Counts nonblank values returned by an expression over a table. |
COUNTX(<table>, <expression>)
|
Rows with Line Value =
COUNTX(
    Sales,
    Sales[Quantity] * Sales[Unit Price]
)
|
| PRODUCTX | Multiplies the numeric results produced for every row. |
PRODUCTX(<table>, <expression>)
|
Compound Growth =
PRODUCTX(
    Rates,
    1 + Rates[Growth Rate]
) - 1
|
SUM versus SUMX
Use SUM when the values already exist in one column. Use SUMX when DAX must first calculate a value for every row.
Use SUM
The Sales Amount column already contains the values to aggregate.
Total Sales =
SUM(Sales[Sales Amount])
Use SUMX
DAX must multiply quantity by unit price for each row before summing.
Total Sales =
SUMX(
    Sales,
    Sales[Quantity] * Sales[Unit Price]
)
The first argument can be a filtered table expression when only selected rows should be evaluated.
Complex row expressions and nested iterators can become expensive over large fact tables.
An iterator creates a current row for its expression, but row context is not automatically the same as filter context.
10 — Context Control
DAX Filter & Context Functions
Filter functions create tables, inspect visible values, and control which filters affect a calculation. They are commonly combined with CALCULATE, CALCULATETABLE, iterators, and other functions that accept table expressions.
| Function | Purpose | Syntax | Example |
|---|---|---|---|
| FILTER | Returns only rows that satisfy a Boolean expression. |
FILTER(<table>, <filter>)
|
High-Value Sales =
CALCULATE(
    [Total Sales],
    FILTER(
        Sales,
        Sales[Sales Amount] > 1000
    )
)
|
| ALL | Returns all rows or values while removing filters from the referenced table or columns. |
ALL(<table or column>)
|
Product % of Total =
DIVIDE(
    [Total Sales],
    CALCULATE(
        [Total Sales],
        ALL(Product)
    )
)
|
| ALLEXCEPT | Removes filters from a base table except filters on specified columns. |
ALLEXCEPT(<table>, <column>)
|
Annual Sales =
CALCULATE(
    [Total Sales],
    ALLEXCEPT(
        'Date',
        'Date'[Year]
    )
)
|
| ALLSELECTED | Removes row and column filters inside a query while retaining filters from outside. |
ALLSELECTED(<table or column>)
|
Product % of Selection =
DIVIDE(
    [Total Sales],
    CALCULATE(
        [Total Sales],
        ALLSELECTED(
            Product[Product Name]
        )
    )
)
|
| REMOVEFILTERS | Clears filters from specified tables or columns without returning a table. |
REMOVEFILTERS(<table or column>)
|
Sales All Categories =
CALCULATE(
    [Total Sales],
    REMOVEFILTERS(Product[Category])
)
|
| KEEPFILTERS | Intersects a CALCULATE filter with an existing filter on the same column. |
KEEPFILTERS(<expression>)
|
Red Sales Kept =
CALCULATE(
    [Total Sales],
    KEEPFILTERS(
        Product[Color] = "Red"
    )
)
|
| VALUES | Returns visible distinct column values or the rows of a referenced table. |
VALUES(<table or column>)
|
Visible Categories =
COUNTROWS(
    VALUES(Product[Category])
)
|
| DISTINCT | Returns a one-column table containing unique values from a column. |
DISTINCT(<column>)
|
Distinct Categories =
COUNTROWS(
    DISTINCT(Product[Category])
)
|
| SELECTEDVALUE | Returns the single visible column value or an alternate result. |
SELECTEDVALUE(<column>, [<alternate>])
|
Selected Category =
SELECTEDVALUE(
    Product[Category],
    "Multiple Categories"
)
|
Choosing a filter-removal function
The correct function depends on which filters should be removed and which selections should continue to affect the result.
REMOVEFILTERS
Clear specific filters
A clear and readable choice when the calculation only needs to remove filters from selected columns or tables.
ALL
Return all rows or values
Useful when a function needs the unfiltered table or column as an intermediate result.
ALLEXCEPT
Preserve selected columns
Removes filters from a table while keeping filters on explicitly listed base columns.
ALLSELECTED
Calculate a visual total
Useful when a percentage should respect slicers while ignoring the current visual row or column.
11 — Virtual Tables
DAX Table Functions
Table functions create, reshape, combine, or rank tables in memory. Their results can power calculated tables or act as virtual tables inside measures, iterators, and filter expressions.
| Function | What it returns | Common use | Syntax |
|---|---|---|---|
| ADDCOLUMNS | The original table plus one or more calculated columns evaluated for every row. | Extend a virtual table before filtering, ranking, or iterating over it. |
ADDCOLUMNS(<table>, "<name>", <expression>)
|
| SELECTCOLUMNS | A table containing only the columns and expressions you specify. | Select, rename, or align columns before combining tables. |
SELECTCOLUMNS(<table>, "<name>", <expression>)
|
| SUMMARIZE | One row for each group, optionally with summary expressions. | Group rows from a table or related tables by existing columns. |
SUMMARIZE(<table>, <group column>, ...)
|
| SUMMARIZECOLUMNS | A grouped summary table with optional filters and scalar expressions. | Create query-style summaries by dimensions, measures, and filters. |
SUMMARIZECOLUMNS(<group column>, "<name>", <expression>)
|
| DISTINCT | Unique values from a column or unique rows from a table expression. | Build a deduplicated list for iteration or comparison. |
DISTINCT(<column or table>)
|
| UNION | Rows from two or more tables combined by column position. | Append tables with the same number of compatible columns. |
UNION(<table1>, <table2>, ...)
|
| INTERSECT | Rows that appear in both input tables. | Find shared customers, products, dates, or other matching sets. |
INTERSECT(<table1>, <table2>)
|
| EXCEPT | Rows in the first table that do not appear in the second table. | Identify missing, inactive, or unmatched members of a set. |
EXCEPT(<table1>, <table2>)
|
| CROSSJOIN | Every possible row combination from the supplied tables. | Generate combinations such as products by regions or scenarios. |
CROSSJOIN(<table1>, <table2>, ...)
|
| TOPN | The highest or lowest rows after sorting by an expression. | Create Top N rankings before aggregating the selected rows. |
TOPN(<n>, <table>, <order expression>, DESC)
|
| CALENDAR | A single Date column containing a continuous range of dates. | Create a date table with an explicitly controlled start and end. |
CALENDAR(<start date>, <end date>)
|
| CALENDARAUTO | A continuous Date column whose range is detected from the model. | Quickly generate a model-driven date table. |
CALENDARAUTO([<fiscal year end month>])
|
Calculated table
Build a reusable date table
Create a continuous date range and add useful calendar attributes.
Date Table =
ADDCOLUMNS(
    CALENDAR(
        MIN(Sales[Order Date]),
        MAX(Sales[Order Date])
    ),
    "Year", YEAR([Date]),
    "Month Number", MONTH([Date]),
    "Month", FORMAT([Date], "MMM")
)
Virtual table
Calculate sales from the top five products
Store a ranked virtual table in a variable, then iterate over its rows.
Top 5 Product Sales =
VAR TopProducts =
    TOPN(
        5,
        ADDCOLUMNS(
            VALUES(Product[Product]),
            "@Sales", [Total Sales]
        ),
        [@Sales], DESC,
        Product[Product], ASC
    )
RETURN
    SUMX(TopProducts, [@Sales])
Summary table
Summarize sales by category
Group by a dimension and add measures as named result columns.
Sales by Category =
SUMMARIZECOLUMNS(
    Product[Category],
    "Sales", [Total Sales],
    "Orders", [Order Count]
)CROSSJOIN operations. Select only the columns and rows needed
for the final calculation.
12 — Data Model Relationships
DAX Relationship Functions
Relationship functions retrieve related values, activate inactive relationships, change filter direction, or transfer filters between tables. They are especially useful in models containing fact tables, dimensions, multiple date columns, and disconnected selectors.
| Function | Purpose | Best used when | Syntax |
|---|---|---|---|
| RELATED | Returns one value from the related lookup or dimension table for the current row. | A row context exists and the model already has a many-to-one relationship. |
RELATED(<column>)
|
| RELATEDTABLE | Returns the rows from another table that are related to the current row. | You need to count or aggregate matching fact-table rows from a dimension row. |
RELATEDTABLE(<table>)
|
| USERELATIONSHIP | Activates a specified existing relationship for the duration of a calculation. | A model has multiple relationships between tables, such as Order Date and Ship Date. |
USERELATIONSHIP(<column1>, <column2>)
|
| CROSSFILTER | Overrides the cross-filter direction of an existing relationship for one calculation. |
A measure temporarily needs Both,
OneWay, or None filtering.
|
CROSSFILTER(<column1>, <column2>, <direction>)
|
| LOOKUPVALUE | Returns a result-column value whose row matches one or more exact search conditions. | You need an exact lookup and cannot conveniently use an existing relationship. |
LOOKUPVALUE(<result>, <search column>, <value>)
|
| TREATAS | Applies values from a table expression as filters to columns in another table. | A disconnected table or selector must filter another part of the model. |
TREATAS(<table expression>, <column>)
|
Which relationship function should you use?
Retrieve one value from the one side or return related rows from the many side.
Temporarily activate an alternate relationship inside
CALCULATE.
Change how filters travel across an existing relationship for one calculation.
Create a virtual relationship by transferring a set of values as a filter.
Practical relationship patterns
Calculated column
Retrieve a product category
Follow the relationship from each Sales row to the matching Product row.
Product Category =
RELATED(Product[Category])
Inactive relationship
Calculate sales by ship date
Use Ship Date instead of the model’s active Order Date relationship for this measure.
Sales by Ship Date =
CALCULATE(
    [Total Sales],
    USERELATIONSHIP(
        Sales[Ship Date],
        'Date'[Date]
    )
)
Virtual relationship
Apply a disconnected region selection
Transfer selected regions from a disconnected selector to the Geography table.
Sales for Selected Regions =
CALCULATE(
    [Total Sales],
    TREATAS(
        VALUES('Region Selector'[Region]),
        Geography[Region]
    )
)13 — Conditions & Validation
Logical & Information Functions
Logical functions control which result an expression returns. Information functions inspect values and filter context, helping measures handle blanks, validate data, and respond intelligently to report selections.
Logical functions
| Function | Purpose | Returns | Syntax |
|---|---|---|---|
| IF | Tests one condition and returns one result when true and another when false. |
The true result, false result, or BLANK() when the
optional false result is omitted.
|
IF(<test>, <if true>, [<if false>])
|
| SWITCH | Compares an expression with multiple values and returns the result for the first match. | One matching scalar result or the optional fallback result. |
SWITCH(<expression>, <value>, <result>, ..., [<else>])
|
| COALESCE | Returns the first expression in the list that is not blank. |
A scalar value, or BLANK() when every expression is
blank.
|
COALESCE(<expression1>, <expression2>, ...)
|
| AND | Checks whether both supplied logical expressions are true. |
TRUE only when both arguments are true.
|
AND(<logical1>, <logical2>)
|
| OR | Checks whether at least one supplied logical expression is true. |
TRUE when either argument is true.
|
OR(<logical1>, <logical2>)
|
| NOT | Reverses the result of a logical expression. | The opposite Boolean value. |
NOT(<logical expression>)
|
&&
Logical AND operator. Unlike the AND function, it can join
more than two conditions.
||
Logical OR operator. Unlike the OR function, it can join
more than two conditions.
SWITCH(TRUE(), ...)
A readable pattern for evaluating several ordered conditions without
deeply nested IF statements.
Information functions
| Function | Purpose | Common use | Syntax |
|---|---|---|---|
| ISBLANK | Checks whether a value evaluates to blank. | Hide incomplete results or display a custom fallback. |
ISBLANK(<value>)
|
| ISNUMBER | Checks whether a value is numeric. | Validate imported or calculated values before using them. |
ISNUMBER(<value>)
|
| ISTEXT | Checks whether a value is text. | Detect text values in mixed or imported data. |
ISTEXT(<value>)
|
| ISERROR | Checks whether evaluating an expression produces an error. | Validate an expression before returning its result. |
ISERROR(<value>)
|
| HASONEVALUE | Checks whether the current context contains exactly one distinct value for a column. | Show a calculation or label only when one item is selected. |
HASONEVALUE(<column>)
|
| ISFILTERED | Checks whether a table or column is being filtered directly. | Change a measure or message when a direct report filter is active. |
ISFILTERED(<table or column>)
|
Practical logical patterns
Multiple conditions
Classify sales performance
Evaluate the most specific condition first because
SWITCH stops after the first match.
Sales Status =
SWITCH(
    TRUE(),
    ISBLANK([Total Sales]), "No data",
    [Total Sales] >= [Sales Target], "Above target",
    [Total Sales] >= [Sales Target] * 0.9, "Near target",
    "Below target"
)
Blank handling
Replace blank sales with zero
Return the measure when it contains a value, otherwise return zero.
Sales Display =
COALESCE(
    [Total Sales],
    0
)
Filter-aware label
Display the selected category
Show a category-specific heading only when the filter context contains exactly one category.
Category Heading =
IF(
    HASONEVALUE(Product[Category]),
    "Category: " & SELECTEDVALUE(Product[Category]),
    "All Categories"
)14 — Build, Extract & Format Text
DAX Text Functions
DAX text functions combine strings, extract characters, search text, replace values, and create readable labels for Power BI reports. They work in calculated columns, measures, and table expressions.
Combine and format text
| Function | Purpose | Common use | Syntax |
|---|---|---|---|
| & | Joins two or more text values using the concatenation operator. | Build names, labels, titles, and composite keys. |
<text1> & <text2>
|
| CONCATENATE | Joins exactly two text strings into one string. | Simple two-value concatenation. |
CONCATENATE(<text1>, <text2>)
|
| CONCATENATEX | Evaluates an expression for every row of a table and joins the results. | Display selected products, regions, categories, or filters. |
CONCATENATEX(<table>, <expression>, [<delimiter>])
|
| FORMAT | Converts a number or date into text using a format string. | Create formatted labels, titles, and narrative measures. |
FORMAT(<value>, <format string>, [<locale>])
|
| UPPER | Converts every letter in a text string to uppercase. | Standardize display labels or text-based identifiers. |
UPPER(<text>)
|
| LOWER | Converts every letter in a text string to lowercase. | Normalize email addresses, codes, or comparison values. |
LOWER(<text>)
|
&
Usually the clearest choice for joining several individual values and text literals.
CONCATENATEX
Use when values come from multiple rows of a table or from a report selection.
FORMAT
Use for display text only because the returned result has a text data type.
Extract, search, and clean text
| Function | Purpose | Common use | Syntax |
|---|---|---|---|
| LEFT | Returns a specified number of characters from the beginning of a string. | Extract prefixes, region codes, or year codes. |
LEFT(<text>, [<characters>])
|
| RIGHT | Returns a specified number of characters from the end of a string. | Extract suffixes, ending digits, or category codes. |
RIGHT(<text>, [<characters>])
|
| MID | Returns characters from the middle of a string using a starting position and length. | Extract a known section from a structured code. |
MID(<text>, <start>, <characters>)
|
| LEN | Returns the number of characters in a text string. | Validate code lengths or locate characters from the end. |
LEN(<text>)
|
| SEARCH | Returns the position of text inside another string without distinguishing uppercase and lowercase. | Perform case-insensitive text matching. |
SEARCH(<find>, <within>, [<start>], [<not found>])
|
| FIND | Returns the position of text inside another string using a case-sensitive search. | Locate text when letter case must match. |
FIND(<find>, <within>, [<start>], [<not found>])
|
| SUBSTITUTE | Replaces matching text with different text, optionally for one specific occurrence. | Replace words, separators, or repeated characters. |
SUBSTITUTE(<text>, <old>, <new>, [<instance>])
|
| REPLACE | Replaces characters identified by their position and length. | Modify a known section of a structured value. |
REPLACE(<text>, <start>, <characters>, <new text>)
|
| TRIM | Removes unnecessary spaces while retaining single spaces between words. | Clean labels containing repeated standard spaces. |
TRIM(<text>)
|
| VALUE | Converts text representing a number into a numeric value. | Convert imported numeric text before calculation. |
VALUE(<text>)
|
Practical text patterns
Calculated column
Build a customer label
Combine several columns and text literals with the ampersand operator.
Customer Label =
Customer[First Name]
    & " "
    & Customer[Last Name]
    & " ("
    & Customer[Country]
    & ")"
Dynamic selection
List selected products
Join the visible product names with a comma and sort them alphabetically.
Selected Products =
CONCATENATEX(
    VALUES(Product[Product Name]),
    Product[Product Name],
    ", ",
    Product[Product Name],
    ASC
)
Narrative measure
Create a formatted revenue label
Convert the numeric result to text and include it in a readable report message.
Revenue Label =
"Revenue: "
    & FORMAT(
        [Total Sales],
        "$#,##0"
)15 — Create, Extract & Compare Dates
DAX Date & Time Functions
Date and time functions create valid date values, extract calendar components, shift dates, calculate intervals, and support the date tables used by Power BI reports.
Create and read date values
| Function | Purpose | Returns | Syntax |
|---|---|---|---|
| DATE | Creates a date from separate year, month, and day numbers. | A date value. |
DATE(<year>, <month>, <day>)
|
| DATEVALUE | Converts a text representation of a date into a date value. | A locale-dependent date value. |
DATEVALUE(<date text>)
|
| YEAR | Extracts the four-digit year from a date. | An integer from 1900 to 9999. |
YEAR(<date>)
|
| MONTH | Extracts the month number from a date. | An integer from 1 to 12. |
MONTH(<date>)
|
| DAY | Extracts the day of the month from a date. | An integer from 1 to 31. |
DAY(<date>)
|
| TODAY | Returns the current date with the time portion set to midnight. | The current date. |
TODAY()
|
| NOW | Returns the current date and time. | The current date and time. |
NOW()
|
| TIME | Creates a time value from hour, minute, and second numbers. | A time represented as a datetime value. |
TIME(<hour>, <minute>, <second>)
|
Shift and compare dates
| Function | Purpose | Common use | Syntax |
|---|---|---|---|
| EDATE | Returns a date a specified number of months before or after another date. | Renewal dates, contract dates, and rolling month offsets. |
EDATE(<start date>, <months>)
|
| EOMONTH | Returns the final day of a month before or after a starting date. | Month-end reporting, due dates, and accounting periods. |
EOMONTH(<start date>, <months>)
|
| DATEDIFF | Counts interval boundaries between two date or datetime values. | Delivery time, customer age, duration, and elapsed periods. |
DATEDIFF(<start>, <end>, <interval>)
|
| WEEKDAY | Returns a number identifying the day of the week. | Separate weekdays from weekends or create weekday sorting. |
WEEKDAY(<date>, [<return type>])
|
| WEEKNUM | Returns the week number for a date according to the selected numbering system. | Weekly reporting and calendar grouping. |
WEEKNUM(<date>, [<return type>])
|
Practical date patterns
Duration
Calculate days to ship
Count day boundaries between the order date and shipping date.
Days to Ship =
DATEDIFF(
    Sales[Order Date],
    Sales[Ship Date],
    DAY
)
Date offset
Calculate a renewal date
Move the customer’s starting date forward by twelve months.
Renewal Date =
EDATE(
    Customer[Start Date],
    12
)
Calendar attribute
Identify weekdays and weekends
Return type 2 numbers Monday as 1 through Sunday as 7.
Day Type =
VAR DayNumber =
    WEEKDAY('Date'[Date], 2)
RETURN
    IF(
        DayNumber <= 5,
        "Weekday",
        "Weekend"
)16 — Period Comparisons
DAX Time Intelligence
Time intelligence functions calculate running periods, previous periods, year-over-year changes, and rolling windows by modifying the active date context.
Quick period totals
TOTALMTD([Total Sales], 'Date'[Date])
TOTALQTD([Total Sales], 'Date'[Date])
TOTALYTD([Total Sales], 'Date'[Date])
Time intelligence function reference
| Function | Purpose | Result type | Syntax |
|---|---|---|---|
| TOTALMTD | Evaluates an expression from the beginning of the current month through the current date context. | Scalar month-to-date result. |
TOTALMTD(<expression>, <dates>, [<filter>])
|
| TOTALQTD | Evaluates an expression from the beginning of the current quarter through the current date context. | Scalar quarter-to-date result. |
TOTALQTD(<expression>, <dates>, [<filter>])
|
| TOTALYTD | Evaluates an expression from the beginning of the current year through the current date context. | Scalar year-to-date result. |
TOTALYTD(<expression>, <dates>, [<filter>], [<year end>])
|
| DATESYTD | Returns the year-to-date dates in the current context. | A table of dates. |
DATESYTD(<dates>, [<year end>])
|
| SAMEPERIODLASTYEAR | Returns the equivalent date period shifted one year backward. | A table of shifted dates. |
SAMEPERIODLASTYEAR(<dates>)
|
| DATEADD | Shifts dates forward or backward by a specified number of intervals. | A table of shifted dates. |
DATEADD(<dates>, <number>, <interval>)
|
| PREVIOUSMONTH | Returns all dates from the month before the first date in the current context. | A table of previous-month dates. |
PREVIOUSMONTH(<dates>)
|
| DATESINPERIOD | Returns a date range starting from a specified date and extending for a chosen number of intervals. | A table used for rolling periods. |
DATESINPERIOD(<dates>, <start>, <number>, <interval>)
|
| PARALLELPERIOD | Returns complete parallel periods shifted by month, quarter, or year. | A table of complete shifted periods. |
PARALLELPERIOD(<dates>, <number>, <interval>)
|
Date table checklist
Practical time intelligence measures
Running period
Year-to-date sales
Accumulate sales from the beginning of the year through the current date context.
Sales YTD =
TOTALYTD(
    [Total Sales],
    'Date'[Date]
)
Previous period
Sales from the previous year
Recalculate the base measure for the equivalent period one year earlier.
Sales Previous Year =
CALCULATE(
    [Total Sales],
    SAMEPERIODLASTYEAR('Date'[Date])
)
Period comparison
Year-over-year percentage
Compare current sales with the same period in the previous year.
Sales YoY % =
VAR PreviousYearSales =
    [Sales Previous Year]
RETURN
    DIVIDE(
        [Total Sales] - PreviousYearSales,
        PreviousYearSales
    )
Rolling window
Rolling 12-month sales
Calculate sales over the twelve-month window ending on the latest visible date.
Rolling 12M Sales =
VAR LastVisibleDate =
    MAX('Date'[Date])
RETURN
    CALCULATE(
        [Total Sales],
        DATESINPERIOD(
            'Date'[Date],
            LastVisibleDate,
            -12,
            MONTH
        )
)17 — Rank & Analyze Distributions
Ranking & Statistical Functions
Ranking functions compare values across a selected set. Statistical functions summarize distributions using medians, percentiles, standard deviation, and variance.
Ranking functions
| Function | Purpose | Best used for | Syntax |
|---|---|---|---|
| RANKX | Evaluates an expression for every row in a table and returns the rank of the current value. | Standard ranking measures for products, customers, and regions. |
RANKX(<table>, <expression>, [<value>], [<order>], [<ties>])
|
| RANK | Returns the ranking for the current context within a relation or partition using an ordering definition. | Advanced window calculations and partitioned rankings. |
RANK([<ties>], [<relation>], [<orderBy>], ...)
|
With SKIP, ranks after tied values contain gaps. Rankings
of 1, 2, 2 are followed by 4.
With DENSE, the next distinct value receives the next
rank. Rankings of 1, 2, 2 are followed by 3.
Use ALLSELECTED when the ranking should preserve external
slicers while ranking the visible items.
Statistical functions
| Function | Purpose | Input | Syntax |
|---|---|---|---|
| MEDIAN | Returns the middle value of the numeric values in a column. | A numeric column. |
MEDIAN(<column>)
|
| MEDIANX | Returns the median of an expression evaluated for every row in a table. | A table and row expression. |
MEDIANX(<table>, <expression>)
|
| PERCENTILE.INC | Returns the inclusive k-th percentile of values in a numeric column. | A column and percentile from 0 through 1. |
PERCENTILE.INC(<column>, <k>)
|
| PERCENTILEX.INC | Returns the inclusive percentile of an expression evaluated over a table. | A table, expression, and percentile. |
PERCENTILEX.INC(<table>, <expression>, <k>)
|
| STDEV.P | Calculates standard deviation when the values represent the entire population. | A numeric column. |
STDEV.P(<column>)
|
| STDEV.S | Estimates standard deviation when the values represent a sample. | A numeric sample column. |
STDEV.S(<column>)
|
| STDEVX.P | Calculates population standard deviation for an expression evaluated over a table. | A table and row expression. |
STDEVX.P(<table>, <expression>)
|
| VAR.P | Calculates variance when the supplied values represent the entire population. | A numeric column. |
VAR.P(<column>)
|
| VAR.S | Estimates variance when the supplied values represent a sample. | A numeric sample column. |
VAR.S(<column>)
|
| VARX.P | Calculates population variance for an expression evaluated over a table. | A table and row expression. |
VARX.P(<table>, <expression>)
|
Use functions such as MEDIAN when the calculation uses one
existing numeric column.
Use the X version when an expression must be evaluated for
every row before the statistic is calculated.
Use .P for the complete population and .S for
a sample used to estimate a larger population.
Practical ranking and statistics measures
Dynamic ranking
Rank products by sales
Rank visible products while retaining external slicer selections and hide the rank on total rows.
Product Sales Rank =
IF(
    ISINSCOPE(Product[Product Name]),
    RANKX(
        ALLSELECTED(Product[Product Name]),
        [Total Sales],
        ,
        DESC,
        DENSE
    )
)
Central value
Median order value
Return the middle sales amount, which is less affected by extreme values than the average.
Median Order Value =
MEDIAN(
    Sales[Sales Amount]
)
Percentile
Calculate the 90th percentile
Find the sales amount at the inclusive 90th percentile of the current filter context.
90th Percentile Order Value =
PERCENTILE.INC(
    Sales[Sales Amount],
    0.9
)
Distribution
Customer sales standard deviation
Measure how widely customer-level sales values vary across the current population.
Customer Sales Std Dev =
STDEVX.P(
    VALUES(Customer[Customer ID]),
    [Total Sales]
)18 — Reusable Business Logic
Common DAX Measure Patterns
Well-designed Power BI models start with simple base measures and build more advanced calculations from them. These reusable patterns cover totals, ratios, filtered results, visual totals, running calculations, rolling averages, and dynamic labels.
Define core calculations such as total sales, quantity, customers, and orders once.
Reference base measures inside ratios, comparisons, filters, and time calculations.
Decide which report filters should remain, be replaced, or be removed for each result.
Foundation measures
Base measure
Total sales
Create one reusable measure for the main sales calculation.
Total Sales =
SUM(
    Sales[Sales Amount]
)
Distinct count
Order count
Count each order identifier once, even when an order contains multiple rows.
Order Count =
DISTINCTCOUNT(
    Sales[Order ID]
)
Safe division
Average order value
Divide sales by orders while safely handling a zero or blank denominator.
Average Order Value =
DIVIDE(
    [Total Sales],
    [Order Count]
)
Filtered measure
Online sales
Recalculate the base measure with an additional sales-channel filter.
Online Sales =
CALCULATE(
    [Total Sales],
    Sales[Channel] = "Online"
)
Analytical measures
Share of total
Product percentage of total
Remove product filters from the denominator while retaining filters from dates, regions, and other dimensions.
Product % of Total =
DIVIDE(
    [Total Sales],
    CALCULATE(
        [Total Sales],
        REMOVEFILTERS(Product)
    )
)
Running calculation
Selected-period running total
Accumulate sales through the current visible date while respecting the selected reporting range.
Sales Running Total =
VAR MaxVisibleDate =
    MAX('Date'[Date])
RETURN
    CALCULATE(
        [Total Sales],
        FILTER(
            ALLSELECTED('Date'[Date]),
            'Date'[Date] <= MaxVisibleDate
        )
    )
Rolling calculation
Rolling daily sales average
Average the daily sales results over the thirty-day period ending on the latest visible date.
Rolling 30-Day Average =
VAR LastVisibleDate =
    MAX('Date'[Date])
RETURN
    AVERAGEX(
        DATESINPERIOD(
            'Date'[Date],
            LastVisibleDate,
            -30,
            DAY
        ),
        CALCULATE([Total Sales])
    )
Weighted calculation
Weighted average price
Weight each unit price by quantity instead of averaging the price column directly.
Weighted Average Price =
DIVIDE(
    SUMX(
        Sales,
        Sales[Unit Price] * Sales[Quantity]
    ),
    SUM(Sales[Quantity])
)
Dynamic report text
Dynamic title
Selected-region heading
Display the selected region in a title and provide a fallback when several regions are visible.
Sales Report Title =
VAR SelectedRegion =
    SELECTEDVALUE(
        Geography[Region],
        "All Regions"
    )
RETURN
    "Sales Performance — "
        & SelectedRegion
KPI status
Sales target status
Return a readable performance label while preserving blank results when sales data is unavailable.
Sales Target Status =
SWITCH(
    TRUE(),
    ISBLANK([Total Sales]), BLANK(),
    [Total Sales] >= [Sales Target], "On target",
    "Below target"
)19 — Real-World Power BI Measures
Practical DAX Business Examples
These practical examples translate common business questions into reusable DAX measures for sales, finance, customer analysis, marketing, inventory, and operations.
Gross profit and gross margin
How much profit remains after direct product costs?
Subtract total cost from sales, then divide profit by sales to calculate the margin percentage.
Gross Profit =
[Total Sales] - [Total Cost]

Gross Margin % =
DIVIDE(
    [Gross Profit],
    [Total Sales]
)Budget variance
How far is the actual result above or below budget?
Show the difference as both an amount and a percentage of the budget. Adjust the subtraction direction if lower values are favorable.
Budget Variance =
[Actual Amount] - [Budget Amount]

Budget Variance % =
DIVIDE(
    [Budget Variance],
    [Budget Amount]
)New customers in the selected period
How many customers made their first purchase during the visible period?
Find each customer’s earliest purchase while removing only the date filter, then compare it with the selected date range.
New Customers =
VAR FirstVisibleDate =
    MIN('Date'[Date])
VAR LastVisibleDate =
    MAX('Date'[Date])
RETURN
    COUNTROWS(
        FILTER(
            VALUES(Customer[Customer ID]),
            VAR FirstPurchaseDate =
                CALCULATE(
                    MIN(Sales[Order Date]),
                    REMOVEFILTERS('Date')
                )
            RETURN
                NOT ISBLANK(FirstPurchaseDate)
                    && FirstPurchaseDate >= FirstVisibleDate
                    && FirstPurchaseDate <= LastVisibleDate
        )
)Conversion rate and return on ad spend
How efficiently does marketing generate conversions and revenue?
Compare conversions with sessions and attributed revenue with advertising spend.
Conversion Rate =
DIVIDE(
    [Conversions],
    [Website Sessions]
)

Return on Ad Spend =
DIVIDE(
    [Attributed Revenue],
    [Advertising Spend]
)
Inventory turnover
How many times was average inventory sold during the period?
Calculate average inventory value, then divide cost of goods sold by that average.
Average Inventory Value =
DIVIDE(
    [Beginning Inventory Value]
        + [Ending Inventory Value],
    2
)

Inventory Turnover =
DIVIDE(
    [Cost of Goods Sold],
    [Average Inventory Value]
)On-time delivery percentage
What percentage of shipped orders met the required delivery date?
Count shipped orders separately, then identify orders whose shipping date did not exceed the required date.
Shipped Orders =
CALCULATE(
    [Order Count],
    Sales[Ship Date] <> BLANK()
)

On-Time Orders =
CALCULATE(
    [Order Count],
    FILTER(
        Sales,
        NOT ISBLANK(Sales[Ship Date])
            && Sales[Ship Date]
                <= Sales[Required Date]
    )
)

On-Time Delivery % =
DIVIDE(
    [On-Time Orders],
    [Shipped Orders]
)20 — Diagnose & Fix DAX
DAX Errors & Troubleshooting
Most DAX problems come from syntax, data types, filter context, relationships, or confusion between scalar and table expressions. Use this reference to identify the likely cause and choose an appropriate fix.
| Error or symptom | Likely cause | What to check | Typical fix |
|---|---|---|---|
| The syntax is incorrect or an unexpected token appears | Missing parentheses, separators, quotation marks, or an invalid table or column reference. | Function arguments, closing parentheses, names containing spaces, and regional separator settings. | Format the expression across several lines and verify one function at a time. |
| A single value for a column cannot be determined | A measure references a column containing several possible values without reducing it to one result. | Whether the expression needs an aggregation, selected value, or row context. |
Use SUM, MIN, MAX,
SELECTEDVALUE, or an iterator.
|
| Multiple columns or a table cannot be converted to a scalar value | A table expression is used where a measure requires a single scalar result. |
Functions such as FILTER, VALUES, and
SUMMARIZE.
|
Reduce the table with COUNTROWS, SUMX,
MAXX, or another aggregation.
|
| Circular dependency detected | Two calculated objects directly or indirectly depend on each other. | Calculated columns, calculated tables, sort-by columns, and dependency chains. | Break the dependency, move reusable logic into a measure, or create the value during data preparation. |
| Relationship is missing, ambiguous, or produces unexpected totals | No valid filter path exists, or multiple active paths can propagate filters between tables. | Relationship cardinality, direction, active status, and matching data types. |
Use a clear star schema and activate alternate paths only when
needed with USERELATIONSHIP.
|
| Division produces an error, infinity, or an unwanted result | The denominator is zero or blank. | Whether the denominator can be missing in the current filter context. |
Replace the division operator with
DIVIDE(numerator, denominator).
|
| Value cannot be converted to the required data type | Text, numbers, dates, or Boolean values are mixed or formatted inconsistently. | Model column types, locale settings, blanks, and invalid text values. | Correct the data type in Power Query or use an explicit conversion only when the source values are valid. |
| Time intelligence returns blanks or incorrect periods | The date table is incomplete, disconnected, contains duplicates, or the wrong date column is used. | Continuous dates, active relationship, date-table marking, and visible date context. | Repair the date table and reference its date column instead of a fact-table date column. |
| Grand total does not equal the visible row values added together | Measures are recalculated in the total filter context rather than automatically summing displayed rows. | Whether the result is a percentage, distinct count, average, or other non-additive measure. |
Keep the context-correct total or explicitly iterate over the
required visible grain with an X function.
|
| Visual exceeded available resources or loads slowly | Expensive iterators, large virtual tables, high-cardinality fields, or too many detailed rows. | DAX query duration, visual granularity, model size, and repeated calculations. | Simplify filters and iterators, reduce unnecessary data, reuse variables, and inspect the visual with Performance Analyzer. |
Five-step troubleshooting workflow
Identify the named function, table, column, and expected result type.
Confirm whether you are creating a measure, calculated column, or calculated table.
Store intermediate expressions in variables and return them one at a time.
Check current filters, row context, relationships, and total-level behavior.
Use Performance Analyzer and test the copied query in DAX query view.
Common formula fixes
Fix a missing scalar value
A measure cannot return an unaggregated column when several categories
are visible. Use SELECTEDVALUE with a fallback.
Category Label =
Product[Category]Category Label =
SELECTEDVALUE(
Product[Category],
"Multiple Categories"
)Reduce a table expression to one result
FILTER returns a table. A measure must aggregate or count
the filtered rows before returning a result.
High-Value Sales =
FILTER(
    Sales,
    Sales[Sales Amount] > 1000
)High-Value Sales =
SUMX(
FILTER(
Sales,
Sales[Sales Amount] > 1000
),
Sales[Sales Amount]
)Handle division by zero
Use DIVIDE when the denominator is an expression that can
return zero or blank.
Profit Margin % =
[Gross Profit] / [Total Sales]Profit Margin % =
DIVIDE(
[Gross Profit],
[Total Sales]
)21 — Faster Models & Measures
DAX Performance & Best Practices
Improve Power BI performance by optimizing the data model first, writing efficient measures, reducing unnecessary calculations and testing slow visuals systematically.
| Area | Recommended | Avoid | Why It Matters |
|---|---|---|---|
| Model design | Use a clear star schema with dimension and fact tables. | Large flat tables and ambiguous many-to-many relationships. | Simplifies filtering and improves usability and performance. |
| Fact grain | Keep each fact table at one consistent level of detail. | Mixing daily, monthly and transaction-level rows in one fact table. | Prevents incorrect aggregation and unnecessary complexity. |
| Model size | Remove unused rows and columns before loading data. | Importing every available field “just in case.” | Smaller models generally refresh and query faster. |
| Data types | Use the smallest appropriate numeric or date data type. | High-cardinality text columns where numeric keys would work. | Appropriate types usually compress more efficiently. |
| Transformations | Perform static row-level transformations in the source or Power Query. | Creating many stored DAX calculated columns. | Reduces model size and moves preparation work outside query time. |
| Measures | Create reusable explicit base measures such as [Total Sales]. |
Repeating raw aggregation logic throughout the model. | Improves consistency, readability and maintenance. |
| Variables | Store repeated expressions with VAR. |
Evaluating the same complex expression multiple times. | Can reduce repeated work and makes measures easier to debug. |
| Filters | Use Boolean filter arguments and KEEPFILTERS when appropriate. |
Using FILTER over an entire table for simple conditions. |
Boolean filters can be handled more efficiently by the engine. |
| Relationships | Prefer active, single-direction relationships by default. | Enabling bidirectional filtering everywhere. | Reduces ambiguity and unexpected filter propagation. |
| Visuals | Display focused summaries and only the detail users need. | Huge tables containing many fields and thousands of visible rows. | Every visual creates queries and rendering work. |
Code Optimization Examples
1. Prefer Simple Boolean Filters
Red Sales =
CALCULATE(
    [Total Sales],
    FILTER(
        Product,
        Product[Color] = "Red"
    )
)
FILTER is valuable for complex expressions, but it is unnecessary for this
simple column condition.
Red Sales =
CALCULATE(
    [Total Sales],
    KEEPFILTERS(
        Product[Color] = "Red"
    )
)
KEEPFILTERS intersects the red condition with any existing color filter.
Omit it when the new condition should overwrite the existing filter.
2. Avoid Repeating Expensive Expressions
Sales YoY Growth % =
DIVIDE(
    [Total Sales] -
        CALCULATE(
            [Total Sales],
            SAMEPERIODLASTYEAR('Date'[Date])
        ),
    CALCULATE(
        [Total Sales],
        SAMEPERIODLASTYEAR('Date'[Date])
    )
)Sales YoY Growth % =
VAR PreviousYearSales =
CALCULATE(
[Total Sales],
SAMEPERIODLASTYEAR('Date'[Date])
)
RETURN
DIVIDE(
[Total Sales] - PreviousYearSales,
PreviousYearSales
)The previous-year result is calculated once, given a meaningful name and reused.
3. Use DIVIDE for Potential Zero Denominators
Gross Margin % =
[Gross Profit] / [Total Sales]Gross Margin % =
DIVIDE(
[Gross Profit],
[Total Sales]
)
DIVIDE safely handles zero or blank denominators and returns
BLANK() by default.
Performance Testing Workflow
- Start recording Open Performance Analyzer in Power BI Desktop and begin recording.
- Refresh or interact Refresh visuals or reproduce the slow report interaction.
- Find the bottleneck Compare visual display time, DAX query duration and other processing time.
- Test and simplify Copy the slow query, inspect its measures and reduce unnecessary model or visual complexity.
22 — Choose the Right Language
DAX vs M vs Excel vs SQL
DAX, Power Query M, Excel formulas and SQL can all calculate or transform data, but they operate at different stages and solve different types of problems.
| Comparison | DAX | Power Query M | Excel Formulas | SQL |
|---|---|---|---|---|
| Primary purpose | Model calculations and analytical measures. | Connect, clean, reshape and combine data. | Calculate values inside worksheets. | Retrieve, filter, join and aggregate database data. |
| Typical location | Power BI semantic model or Power Pivot. | Power Query Editor in Power BI or Excel. | Excel worksheet cells and tables. | Relational database or data warehouse. |
| When it runs | Measures run when queried; calculated columns run during refresh. | Primarily during data refresh. | When dependent worksheet values recalculate. | When the database receives and executes the query. |
| Works mainly with | Tables, columns, relationships and filter context. | Queries, transformation steps, lists, records and tables. | Cells, ranges, arrays and worksheet tables. | Database tables, views, rows and result sets. |
| Best for | KPIs, ratios, time intelligence and interactive report calculations. | Data cleaning, type changes, merging, pivoting and unpivoting. | Flexible analysis and calculations in standalone workbooks. | Source filtering, joins and large-scale data preparation. |
| Context awareness | Responds dynamically to slicers, filters and report selections. | Uses the ordered transformation steps in a query. | Uses cell and range references. | Uses clauses such as WHERE, GROUP BY and joins. |
| Typical output | A scalar value or virtual table used by another expression. | A transformed table or another M value. | A value or dynamic array returned to worksheet cells. | A tabular result set or database modification. |
| Not ideal for | Cleaning every row before loading it into the model. | Measures that must react instantly to report filters. | Building reusable semantic-model measures. | Calculations dependent on Power BI visual filter context. |
Where Each Language Fits
- 1. SQL Retrieve and reduce source data
- 2. Power Query M Clean and reshape imported data
- 3. Data Model Create tables and relationships
- 4. DAX Calculate interactive report results
The Same Sales Task in Four Languages
DAX
Dynamic measure evaluated in the current report context.
Total Sales =
SUMX(
    Sales,
    Sales[Quantity] * Sales[Unit Price]
)
Power Query M
Adds a sales amount column during data preparation.
Table.AddColumn(
    Source,
    "SalesAmount",
    each [Quantity] * [UnitPrice],
    Currency.Type
)
Excel Formula
Calculates total sales from two worksheet ranges.
=SUMPRODUCT(B2:B100,C2:C100)SQL
Aggregates sales directly in the database.
SELECT
    SUM(Quantity * UnitPrice) AS TotalSales
FROM Sales;
Which Tool Should You Use?
- The result must react to slicers and report filters. Create an explicit measure in the semantic model. Use DAX
- You need to clean, split, merge, pivot or reshape imported data. Apply repeatable transformation steps before the data reaches the model. Use Power Query M
- The calculation belongs in a standalone spreadsheet. Use cell, range, table or dynamic-array references. Use Excel
- A large database can filter or aggregate the data efficiently. Push suitable operations closer to the source when practical. Use SQL
- You need a static category or column for grouping. Prefer creating it upstream when possible, especially when it does not depend on report context. Use SQL or Power Query
- You need year-over-year growth for every report selection. Build a measure that evaluates against the current date and filter context. Use DAX
23 — Frequently Asked Questions
Power BI DAX FAQ
Quick answers to common questions about DAX formulas, measures, calculated columns, filter context, Power Query and performance.
What is DAX in Power BI?
DAX stands for Data Analysis Expressions. It is the formula language used to create measures, calculated columns, calculated tables and row-level security rules in Power BI and other tabular data models.
Is DAX the same as Excel formulas?
No. Many functions look similar, but Excel formulas usually reference cells and ranges. DAX works with tables, columns, relationships and evaluation context. A DAX measure can return different results as report filters and slicers change.
What is the difference between a DAX measure and a calculated column?
A calculated column produces and stores a value for every row during model refresh. A measure calculates a result when it is queried and responds to the current filter context. Measures are usually preferred for report aggregations and KPIs.
Should I use DAX or Power Query?
Use Power Query to connect, clean and reshape data before it enters the model. Use DAX for calculations that belong in the model, especially measures that must respond to report filters and slicers.
Why does my DAX measure show the wrong total?
A total evaluates the measure again in the total row’s filter context. It does not
necessarily add the values displayed above it. When row-by-row logic is required,
an iterator such as SUMX may provide the intended result.
What does CALCULATE do in DAX?
CALCULATE evaluates an expression in a modified filter context. It can add,
replace, preserve or remove filters and is central to ratios, time intelligence and
other context-sensitive calculations.
What is filter context in DAX?
Filter context is the set of values allowed for a calculation. It can come from slicers, visual rows and columns, page filters, relationships or filter arguments inside the DAX expression.
Why should I use VAR and RETURN?
Variables give expressions meaningful names, avoid repeating the same calculation and
make complex measures easier to read and debug. Define variables with VAR,
then return the final expression with RETURN.
Why should I use DIVIDE instead of the division operator?
DIVIDE safely handles a denominator that is zero or blank. By default it
returns BLANK(), although you can provide an alternate constant result as
its third argument.
Why is my time-intelligence formula not working?
Check that your model has an appropriate date table, a continuous date column and the correct relationship between the date table and fact table. Also verify that the visual supplies the intended date context.
Is DAX only available in Power BI?
No. DAX is also used with Analysis Services tabular models and Power Pivot in Excel. Available functionality can vary by product and compatibility level.
How can I make DAX measures faster?
Start with the model before micro-optimizing individual expressions:
- Use a clear star schema.
- Remove unnecessary rows and columns.
- Prefer reusable explicit measures.
- Use variables for repeated expressions.
- Avoid unnecessary full-table filters.
- Use Performance Analyzer to identify slow visuals and queries.
What is the best way to learn DAX?
Begin with measures, filter context and CALCULATE. Then learn variables,
iterator functions, relationships and time intelligence. Practice each concept with a
small star-schema model so you can observe how filters change the result.
24 — Printable Reference
Download the Power BI DAX Cheat Sheet PDF
Download a free printable reference containing essential DAX functions, syntax rules, measure patterns and practical Power BI examples.
Power BI DAX Quick Reference PDF
Keep this compact DAX reference available offline or print it for quick access while building Power BI reports and semantic models.
- Core DAX syntax and operators
- Filter and context functions
- Time-intelligence formulas
- Reusable business measures
- Troubleshooting checklist
- Performance best practices
PDF format · 12 A4 pages · Approximately 421 KB · Free to download